Get up to 25% OFF on all IT courses Enrol Now Only 20 Slots Remaining! Limited Time Offer!
By Tanmay Das

Seeking a career in data analytics? You have made a superb choice. However, to build a successful data analytics career, you not only need to have an in-depth understanding but also learn the tools used in data analytics. Whether you are considering a career or curious about data analytics, we have curated a list of top tools used in data analytics that will help you grow and advance. Let’s get started!
Data analytics has increasingly become an integral part of every industry.
From predicting future trends, understanding customer behaviour, to making accurate decisions, data analytics helps businesses thrive. This is the key reason why India’s data analytics market is projected to reach a value of $21.3 billion by 2030, at a CAGR (Compound Annual Growth Rate) of 35.8% from 2025 to 2030.
As of August 2025, there were 7,115 job openings for data analysts in India, demonstrating a strong demand for the expertise.
With the surge in demand for data professionals, many people are enrolling in data analytics courses to learn the skills needed to succeed in the field.
Whether you’re getting an advanced data analytics certification offline, planning to take an online course, or seeking to upskill to stay competitive, your first move should be to learn and master the right data analytics tools.
Which is why we are here with this beginner’s guide to data analytics, with a list of the top 8 tools used in data analytics. Explore each tool, know its pros and cons, and its real-world use to make the right career decision.
Let’s dive in!
Data analytics tools are software applications and platforms that help users and businesses in collecting, processing, analysing, and visualising a set of data to extract meaningful insights. Different data analytics tools allow users to solve problems, identify trends, make future predictions, and promote data-driven decisions.
Data analytics tools are essential for the data analysis lifecycle, including
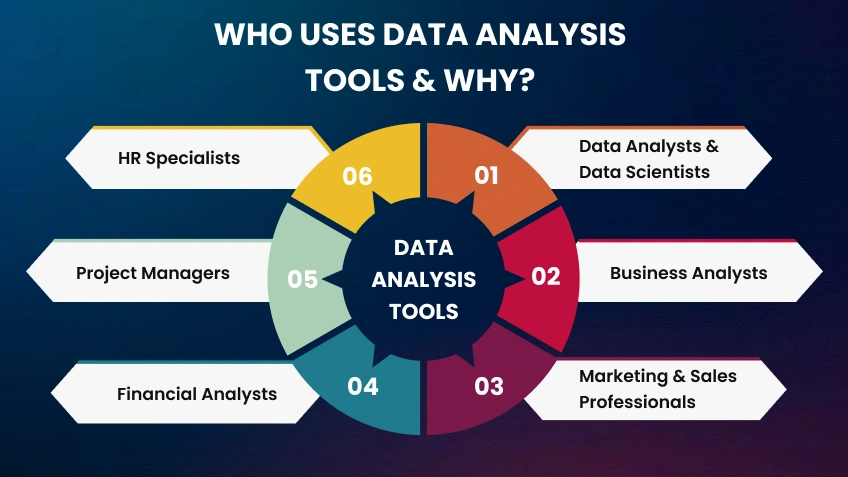
Data analysis tools are not only used by specialists but also by data analysts, data scientists, and more. Here is the list.
Data analysts and data scientists are among the primary users of data analysis tools. They use data analytics tools to collect, clean, and interpret data to find patterns, trends, and solve complex problems. They use data analytics tools to build predictive models, perform statistical analysis, and create visualisations.
Business analysts also leverage data analytics tools to make informed business decisions and improve overall processes. They use extracted insights to answer stakeholder questions, create dashboards and reports to identify growth opportunities, increase profitability, and optimise operations.
Marketing and sales professionals also use data analysis tools to understand customer behaviour and optimise advertising campaigns. They analyse key metrics like website traffic, conversion rates, etc., to identify what is working, what’s not, and what needs to be improved.
Financial analysts leverage different data analysis tools to predict market trends, analyse risks, and manage budgets. They assess large datasets of financial statements, stock market data, etc., to forecast future performance. It also helps them in detecting fraud, building financial models, allocating resources, and making investment recommendations.
Project managers leverage data analysis tools to monitor progress, manage resources, and minimise risks. They use data analysis tools to track key performance indicators like project timelines, budget, and task completion rate. Leveraging data analysis tools, project managers identify potential risks, adjust schedules, and ensure the project stays on track for more successful outcomes.
HR specialists use data analysis tools to streamline the recruitment process, improve employee retention, and boost productivity. By analysing data like employee turnover rates, performance metrics, and job satisfaction scores, HRs create better retention strategies, design training programs, and make more effective hiring decisions.
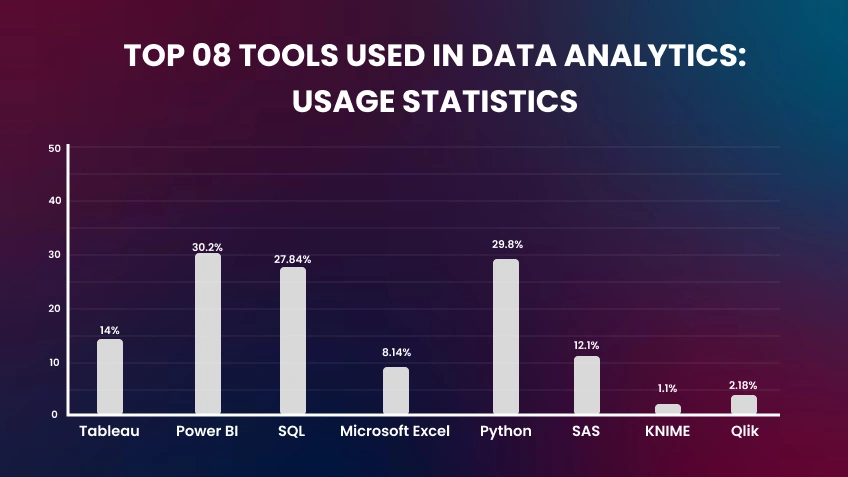
Here is the list of the top 8 tools used in data analytics, visualisation, and business intelligence.
Tableau is one of the best tools used in data analytics and data visualisation. This business intelligence tool can transform complex data into easy-to-understand, interactive visualisations and dashboards.
Best For:
Real-World Use:
| Pros | Cons |
| Easy to learn and use for beginners. | Limited data cleaning capabilities in the free version. |
| Highly interactive dashboards. | Not the primary tool for complex data engineering tasks. |
| Process and visualise large datasets efficiently. | |
| Abundant free tutorials, forums, and shared projects | |
| Highly sought-after skill for many in-demand data roles. |
Developed by Microsoft, Power BI is another powerful tool for data analytics, visualisation, and business intelligence. This tool helps users connect to numerous data sources and create appealing dashboards and reports. Power BI seamlessly integrates with popular Microsoft products like Excel and Office 365, which makes it a popular choice for several businesses.
Best For:
Real-World Use:
| Pros | Cons |
| An accessible tool for beginners to practice and build a portfolio. | Mastering DAX (Data Analysis Expressions) for advanced calculations can be challenging for beginners. |
| Smooth learning curves as the interface and functions are familiar to Excel. | Might slow down while working with large datasets. |
| Powerful capabilities for data modelling. |
SQL (Structured Query Language) is another standard language for handling and manipulating relational databases. While SQL is not a general-purpose programming language, it is essential for data professionals to interact with, retrieve, clean, and aggregate databases.
Best For:
Real-World Use:
| Pros | Cons |
| Easy to learn the basics; beginners can start querying and manipulating data quickly. | Can be challenging to scale. |
| Highly valuable and marketable skill across a range of industries. | Not ideal for unstructured data. |
| Efficiently performs highly complex operations. | Complex queries can be difficult to optimise. |
| Can be easily integrated with a variety of programming languages and business intelligence tools. |
Microsoft Excel is a widely used and foundational spreadsheet tool for data analytics, management, and visualisation. Experience with this tool is a prerequisite for almost every professional role today. Excel is an excellent tool for learners to build fundamental data skills. Data analytics tools in Excel give a path to more advanced tools.
Best For:
Real-World Use:
| Pros | Cons |
| A universal skill required for almost every job role. | Manual data entry can lead to errors. |
| Easy to learn for beginners. | Lacks the advanced, interactive visualisation capabilities of modern tools like Power BI or Tableau. |
| It can be used for several tasks beyond data analysis. |
Python is a popular programming language, a widely used tool for data analytics, automation, and machine learning. Its simple, readable syntax makes Python an excellent choice for learners. Python is a powerful tool for complex tasks and a top IT skill in demand. Data analytics tools in Python which also provide a data science roadmap.
Best For:
Real-World Use:
| Pros | Cons |
| Simple syntax and clear structure make it easier to learn for new programmers. | Slower than Java or C++ for specific high-performing tasks. |
| One of the most in-demand programming languages for data science and data analytics. | Mastering the language for complex projects can take time. |
| Massive library provides ready-to-use features for data analysis. | |
| Versatile; can be used for data analytics, web development, scientific computing, and software engineering. |
SAS (Statistical Analysis System) is another powerful tool for data analytics, business intelligence, and data management. This tool offers robust data security and statistical analysis capabilities, making it reliable for enterprise-level, complex tasks.
Best For:
Real-World Use:
| Pros | Cons |
| Clear, procedural syntax can be easier for beginners to grasp. | Steep learning curve for non-statisticians. |
| Highly secure and reliable for managing sensitive data. | Limited use; cannot be used for general software engineering, app creation, or web development. |
| Extensive and high-quality learning resources. | |
| Provides a solid foundation in data management, statistical theory, and analytical workflow. |
KNIME (Konstanz Information Miner) is another popular tool for data analytics and reporting. This tool allows users to build complex data pipelines without writing code via a visual, node-based workflow.
Best For:
Real-World Use:
| Pros | Cons |
| The drag-and-drop interface makes it accessible for non-programmers to start working with data. | Steep learning curve for advanced use. |
| Highly versatile and offers seamless integration with any data source. | Limited customisation. |
| Offers a vast library of nodes for text processing and social network analysis. | Performance issues when handling very large datasets or complex operations. |
| The visual workflow makes it simple to share and explain a data project to anyone. |
Qlik is another leading business intelligence tool and data visualisation platform that allows users to create interactive reports and dashboards. Its drag-and-drop functionality makes Qlik accessible for a wide range of users.
Best For:
Real-World Use:
| Pros | Cons |
| Intuitive drag-and-drop features make it easy for learners to create compelling dashboards. | Steep learning curve for advanced use. |
| Qlik’s Associative Engine allows users to explore data freely. | Performance issues when dealing with extremely large or highly complex datasets. |
| Allows for seamless data connection, cleaning, and transformation. | |
| Offers a wide array of learning resources. |
We hope this beginner’s guide to data analytics has helped you understand what data analytics is, what it does, who it helps, and the top tools used in data analytics.
Mastering these tools can help you tap into a booming tech career and command a high salary in top IT companies.
To become successful in this path, you need reliable training that offers a comprehensive curriculum and hands-on experience. Our practical-focused data analytics course can help you master all the in-demand tools and build a fulfilling career in this booming field.
Let’s discuss how we can help you kickstart a rewarding career in data analytics today.
Call us today 9836423755 | 6289562294 | 8910945693
What is the most used tool in data analytics?
The most used data analytics tool depends on its usage. For instance, SQL is considered fundamental for professionals to retrieve data. Whereas Python, Power BI, and Tableau are industry standards.
Should I learn a coding language or a visualisation tool?
Consider learning both as they are complementary. Visualisation tools like Power BI and Tableau help in creating dashboards quickly. On the other hand, Python allows you to perform statistical analysis, advanced data cleaning, and build machine learning models.
Which AI tool is best for data analysis?
The best AI tool depends on the task. For example, Power BI and Tableau have integrated artificial intelligence for natural language queries and quick insights. Python, with its extensive libraries like SciPy, Scikit-learn, and TensorFlow, is the industry standard for building custom, advanced machine learning models and automation.
What’s the main difference between Power BI and Tableau?
While both are powerful BI tools, Power BI offers strong integration with Microsoft, and Tableau handles large, complex datasets, which is more preferred by analysts for high-quality data visualisation.
Which data analytical tool is the best for a beginner?
Microsoft Excel is the best data analytical tool for a beginner. It is widely used and has a low learning curve for basic data manipulation and analysis. Also, it offers a strong foundation for understanding data concepts.
What are the three main types of data analytics?
The three main types of data analytics are descriptive, predictive, and prescriptive. Descriptive analytics describe what happened, predictive analytics forecast what might happen, and prescriptive analytics recommend what measures should be taken.
Is Python a better choice than Excel for data analysis?
Yes, Python is considered a better choice than Excel, especially when it comes to analysing complex and large data sets. Python allows for automation, statistical modelling, and machine learning, which are not possible in Excel.
Can I get a job by only knowing one of these data analytics tools?
Yes, you can get a job knowing any of the tools used in data analytics. However, most jobs today require a combination of skills. For instance, today, a data analyst might require proficiency in SQL for data extraction, Tableau/Power BI for data visualisation, and Python/R for data analysis.
Read more blogs: